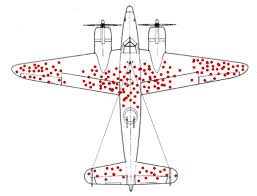
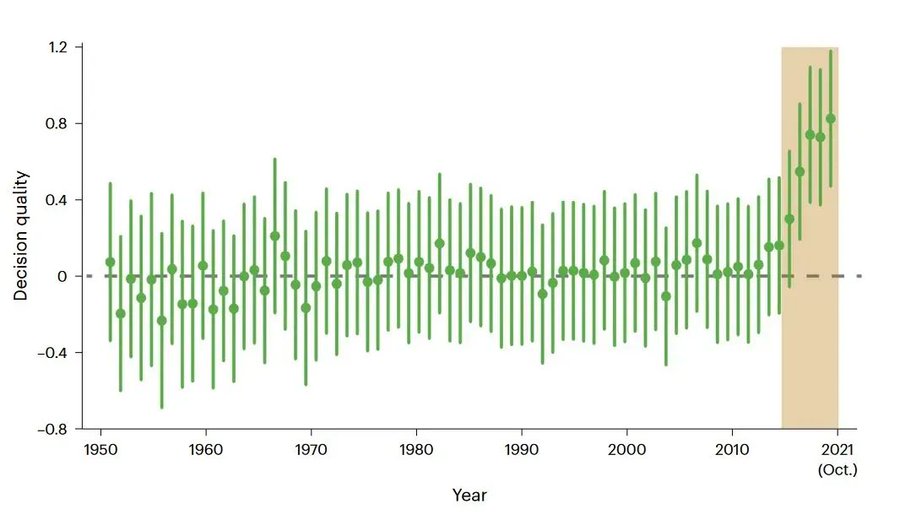
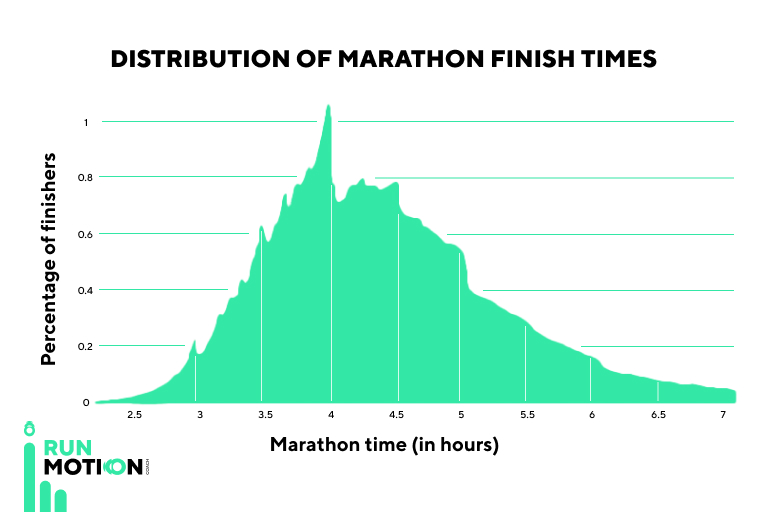
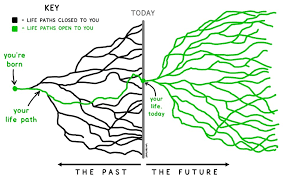
Survivorship BiasDuring WWII, the military wanted to add armor to bombers but couldn't cover everything. They studied returning planes and found bullet holes clustered on the wings and fuselage. The obvious move was to armor those spots. Mathematician Abraham Wald pointed out the flaw: they were only looking at planes that survived. The holes showed where a plane could take damage and still fly home. The planes hit in the engines never came back. Armor the places without holes.Move 37In 2016, AlphaGo played Move 37 against Lee Sedol, a move so unconventional that commentators assumed it was a mistake. It had a one-in-ten-thousand chance of being played by a human. It won the game. This chart shows what happened next: after studying AlphaGo, human Go players got measurably better. Decades of flat decision quality, then a sharp spike. The machine didn't replace human creativity. It expanded it.Marathon Finish TimesLook at the spikes at 3:30, 4:00, and 4:30. Thousands of runners hit the exact round number they aimed for. The distribution should be smooth, but it isn't, because people set goals and then meet them. Goals are arbitrary and achievable so long as you set them.Life PathsEvery decision you've made has closed off paths. That's the past on the left, narrowing down to where you are today. But look at the right side. The future branches out just as wide as the past. There are always more paths forward than you think.